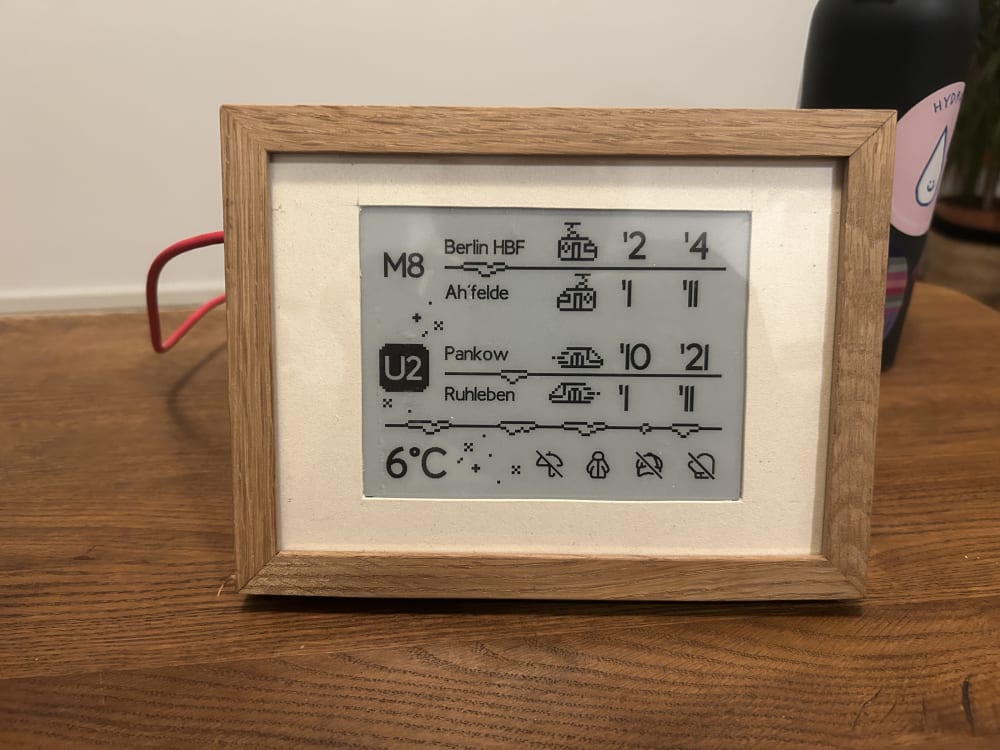
I recently made an e-paper display to track train timings and show the weather. Here's a small video of how it looks.
Materials
- Waveshare E-paper display: Berrybase
- Raspberry Pi Pico 2W (mit Headers): Berrybase
- 130x180mm Wooden Frame (Similar to this one - Modular)
Why e-paper
I wanted a display that I could leave switched on all day, so power consumption was a deciding factor. I also wanted it to fit into a frame and be powered by batteries, so that it didn't need a power outlet nearby.
An e-paper display is perfect for this. The major limitation with an e-paper display is that it has a pretty bad refresh speed (2-3s), which makes it terrible for animations, videos, or use-cases that may require a refresh every second. For my use-case I could refresh the display every minute, since that's how most train timing displays work at train stations.
I also wanted to show the weather, and this too doesn't need constant refreshing.
Data
I used the BVG API (https://v6.bvg.transport.rest/) for train and tram timings in my area.
I fetched the data for the U ROSA-LUXEMBURG STOP (ID: 900100016).
https://v6.bvg.transport.rest/stops/900100016/departures?duration=60&linesOfStops=false&remarks=true&language=en
I shortlisted this to just the tram and u-bahn, since I rarely use the bus. I got the timings and directions for each line.
For the weather I used Weather API(https://www.weatherapi.com/). I got the "Feels like" temperature and the precipitation in mm.
Design
Version 1
I used Figma to create the designs. I kept the public transport timing display the same as on Berlin stops, one line for each unique trip.
On the left of the timings I added temperature and decided to show icons for a coat, a cap, a glove, and an umbrella. Since I'm planning on having this near the door (and coat hanger), I wanted the display to inform me whether or not I needed to take any of these with me based on the weather.
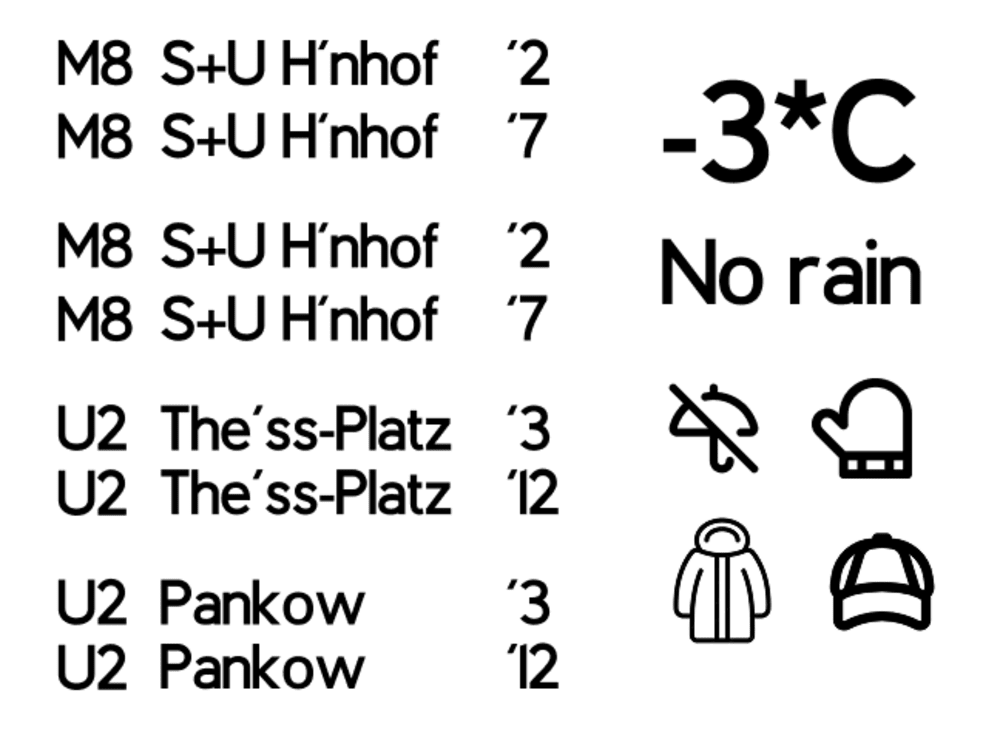
A major problem with this version was that the text for the timings was too small to see from a distance.
Version 2
I simplified the timings, and showed one line per direction. So, for example, from U Rosa Luxemburg the train can either go towards S+U Pankow (Berlin), or towards Ruhleben. Sometimes the train towards Ruhleben only runs until Theodor-Heuss-Platz. This is decided to leave out from the display for now (since I don't travel that far on this line regularly).
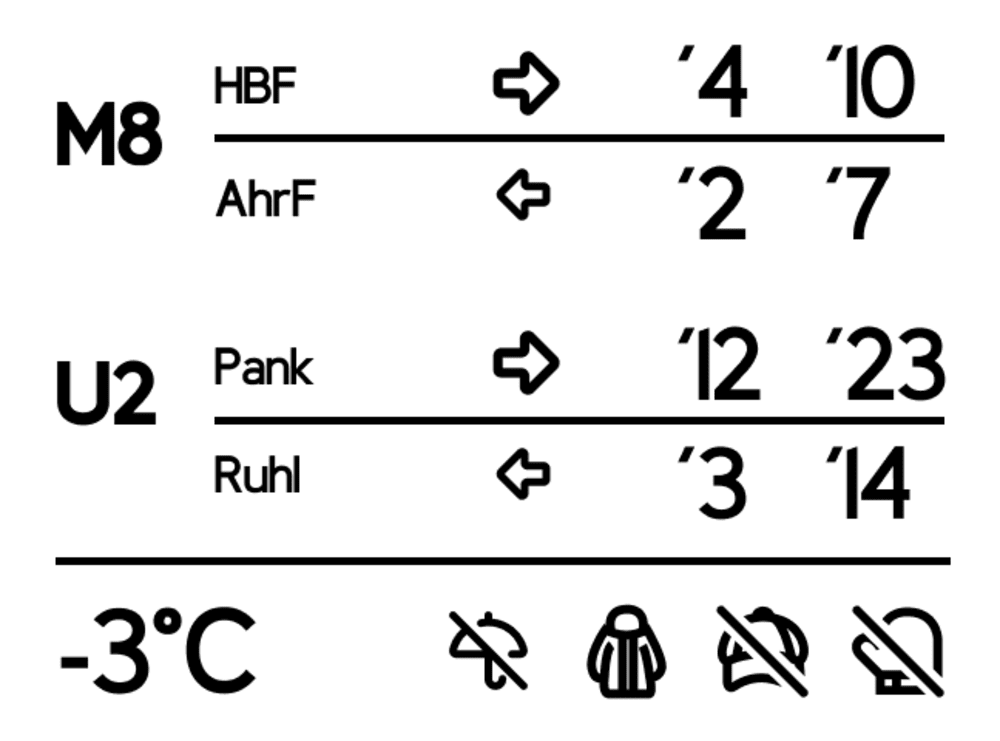
This design seemed to have better readability from a distance.
Version 3
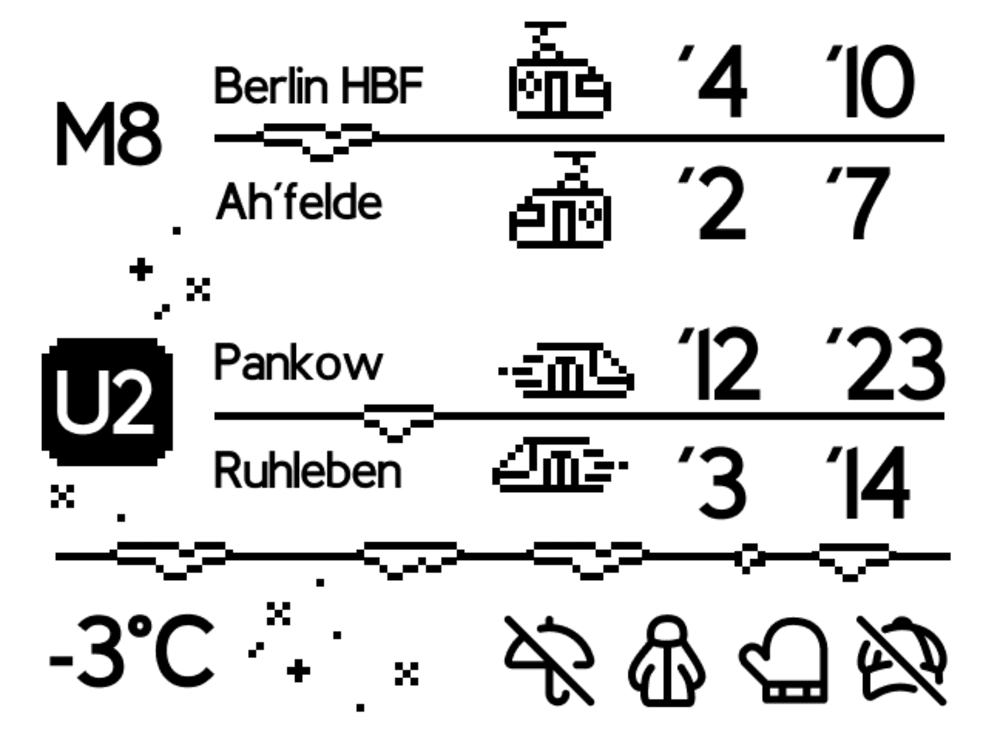
I created some pixel-style icons for the tram and train, and added some snow as some winter flair.
Creating the image for display
I wrote the code in python for fetching the data from the APIs and I used the Pillow library to create the UI. I used the background image directly from Figma. For the dynamic bits I loaded the font in python using ImageFont (Pillow), and then positioned it appropriately on the screen to match the UI.
The E-paper display requires a .bin file. I found a converter (image_to_epd_bin) for image to bin files that I used here.
Github: https://github.com/karanmhatre1/bvg-weather-e-paper-display
Hosting the program
I hosted this program on my Raspberry PI home server. I ran a simple python server and exposed the generated .bin image on the home network. I ran the program in the background using nohup. The program fetches the data and generates a new image every minute.
I had the file output.bin accessible at 192.168.2.80:4141/output.bin
Building the display
I used the Raspberry PI PICO 2 W (with headers) to run the basic logic required to show the image on the display. I got the Waveshare 5.83 e-paper display. This comes with an e-paper driver module that fits directly into the Pico.
Programming the display
Connecting the PICO and Waveshare display was straightforward. I got the EPD library from the Demo code on the Waveshare website (https://www.waveshare.com/wiki/Pico-ePaper-5.83#Demo_codes). This gives a boilerplate library for displaying text and images, clearing the screen, refreshing the screen, etc.
Every 2 minutes, the program fetches the .bin image from the home server and displays it on the display.
Building a Frame
I used a A5 sized wooden frame. I created a thick paper mount for the display. Doubled-sided tape to attach the pico and epaper driver behind frame.
Future scope
- Connect some kind of rechargeable battery
- Figure out a solution to show the correct end-stop for each trip
- Make a good casing for the pico behind the frame